
Many incidents start as undetected signals long before a user notices anything wrong. A drive reporting SMART errors for weeks before it fails. An application crashing silently on a handful of machines before it starts affecting an entire department. A thermal anomaly that precedes a CPU throttle event by days. Most IT teams have access to this data but lack a systematic way to watch the right signals across a distributed fleet.
This guide covers the specific endpoint performance metrics worth tracking across hardware, applications, and security posture, along with the monitoring and remediation tools built into the HP Workforce Experience™ Platform (WXP) that turn those signals into automated action.
Hardware health metrics
Four hardware-level signals provide useful visibility into common endpoint failure modes. Tracking all four can provide earlier warning of several common endpoint hardware issues.
CPU utilization is the most immediate indicator of workload imbalance or resource exhaustion. Sustained CPU utilization above 90% can indicate a resource-intensive workload, a runaway process, or, in combination with high temperatures, thermal throttling. Monitoring this at the fleet level lets you spot outliers before users open a support ticket about slowness.
Thermal levels connect directly to cooling failures and workload mismatches. A thermal spike on a device doing the same workload as its peers can indicate a cooling or configuration issue, such as fan degradation, blocked vents, or a thermal-interface problem. WXP surfaces predictive hardware alerts, including “Fan Warning” and “Fan Critical” alerts, for devices on eligible HP service tiers, catching these events before they escalate.
Drive health is the metric most teams check reactively. Drives begin reporting SMART warning signals well before they fail outright, giving IT teams a window to migrate data and schedule a replacement before any data loss occurs. WXP automatically surfaces “HDD Predictive Failure” alerts, giving you time to migrate data and replace the drive on your schedule rather than in response to data loss.
Battery health affects every fleet with laptops or mobile endpoints. Battery capacity degrades over charge cycles, and a device that can’t hold a charge becomes effectively tethered, or goes dark without warning. Tracking battery health across the fleet lets you build replacement cycles based on actual degradation data rather than arbitrary refresh schedules.
Each metric maps to a specific, actionable failure mode. Thermal spikes expose cooling issues, drive health scores set replacement windows, and battery health tells you when a laptop stops being portable.
Application performance and stability metrics
Hardware metrics show if the device is working properly. Application metrics show if the actual work is getting done.
Application performance scores aggregate response times and resource consumption into a per-application signal. A score that trends downward over weeks often indicates a software update introduced a regression, or that a background process is competing for resources. Catching this trend at the fleet level, rather than through a wave of individual complaints, is the difference between a planned rollback and an emergency.
Crash frequency directly signals software conflicts and driver incompatibilities. A single application crashing repeatedly on devices that recently received a driver update strongly signals a compatibility issue. WXP tracks crashes per application and surfaces the “Apps with Most Crashes” view on the home dashboard, so you can see which applications are generating the most incidents across the fleet without building a query.
BSOD event counts catch the failures that crash frequency misses. Blue screen events often indicate driver conflicts or memory errors that application-level crash data doesn’t expose. Trending BSOD frequency by device or device group surfaces whether a specific hardware model, OS build, or software configuration is the common factor.
Adoption trends round out the picture. An application deployed fleet-wide but showing unusually low usage in a department might indicate a configuration, training, workflow, or compatibility issue worth investigating. Catching the low-usage pattern early lets you intervene before it becomes a problem.
Tracking application metrics alongside hardware metrics is necessary because crashes and BSODs often persist on machines that look healthy at the hardware layer. Driver conflicts don’t show up in thermal readings, so the two monitoring layers serve different diagnostic purposes.
Security and compliance metrics
Security vulnerabilities carry the same operational risk as a failing drive. A device running an unpatched critical vulnerability is a potential incident, and that incident will cost more than a drive replacement. Managing security posture as a separate workflow from device health monitoring creates coverage gaps by forcing you to manage the same endpoint twice with different tools.
Patch compliance status tells you which devices in the fleet are running software with known vulnerabilities. WXP surfaces vulnerability alerts categorized by severity (Critical, High, and Medium), so you can prioritize remediation by actual risk level rather than patching everything on the same cadence. Devices that consistently fall behind on patches often share a common configuration or network characteristic worth investigating.
Security alert counts, tracking the volume and severity of active alerts over time, give you a posture trend rather than a point-in-time snapshot. A fleet that generates increasing alert volume week over week is drifting, even if no single alert looks critical in isolation. WXP’s Alerts view displays active device-level and fleet-wide alerts with severity, status, and creation timestamps, making that trend visible without a custom report.
Policy adherence covers whether devices are configured to match your organization’s security baseline, including encryption status, antivirus configuration, firewall settings, and authentication requirements. Devices that drift from policy are exposure points, and continuous monitoring can catch that drift before it becomes a problem, because periodic audits alone won’t.
For more on endpoint security practices, the WXP Learning Center’s Endpoint Security category has additional resources on building a layered security approach.
Monitoring tools and dashboards
WXP surfaces hardware health, application performance, and security posture in a single SaaS dashboard, pulling telemetry from the WXP Insights Agent deployed across Windows, macOS, and Android endpoints. You get continuous visibility rather than point-in-time snapshots, with severity-based alerts that fire automatically when a metric drifts outside the expected range.
The home dashboard is customizable through a drag-and-drop widget library covering categories including Applications, BIOS, DEX Score, Drivers, Network, OS Performance, PC Hardware, Security, Sentiment, Sustainability, and System Health. You can duplicate predefined dashboards and reconfigure them for your team’s priorities, or build a view from scratch. For a fleet of a few hundred devices, a single dashboard view showing CPU utilization, crash frequency, and active security alerts covers most of what a daily standup needs.
When a widget surfaces an anomaly, the Deep-dive dashboard lets you drill down by department, device, operating system, and location. That segmentation is where the real diagnostic work happens. If a spike in BSOD events appears in the fleet-wide view, filtering by OS build in the deep-dive view tells you whether it’s isolated to devices that received a specific update.
WXP’s AI-powered analytics chatbot lets you query performance and usage trends without writing a report. The Fleet Explorer capability uses the chatbot interface for questions like which devices are showing battery degradation above a threshold, or which applications have the highest crash rates in a specific department, returning answers directly rather than requiring you to navigate a report tree.
For recurring reporting needs, WXP supports schedulable custom reports with automatic email delivery at daily, weekly, monthly, or quarterly frequencies. Duplicate an existing report, rename it, apply the filters you need (by device group, OS, location, or metric), and set the schedule. That report lands in the right inboxes without manual intervention.
WXP integrates directly with Microsoft Intune, ServiceNow, Power BI, and Tableau, so the telemetry it collects can flow into existing workflows rather than creating a parallel system. The WXP Developer Portal provides API access for teams that want to build custom integrations on top of the platform.
Remediation with automated tools and remote actions
Surfacing a problem is only half the job. Fixing it without dispatching a technician to every affected device is the other half.
WXP’s Remediation module resolves issues through two mechanisms. The first is automated scripts and policies. WXP includes a Script Library for custom scripts and a Script Gallery of pre-built scripts for common tasks, including driver updates, BIOS configuration, and diagnostic routines. Scripts deploy to device groups and can run on a one-time or recurring schedule. Policies automate configuration enforcement across the fleet, covering BIOS settings, authentication, and driver deployment, and assign them to specific device groups so the right configuration reaches the right machines without manual targeting.
The second mechanism is direct remote actions. WXP’s Remote Connect feature lets IT teams securely connect to a supported device for real-time troubleshooting and remediation, including shared keyboard and mouse control. Out-of-band Remote Connect can also support compatible devices when the operating system isn’t running.
Alerts in WXP are severity-categorized and include built-in recommended actions, so the path from alert to fix is short. The Active Alerts page shows each alert’s severity, status, metric, occurrence count, serial number, and last signed-in user, enough context to act without opening another tool.
To improve per-device visibility today, configure a custom alert rule in Tech Insights Monitoring by navigating to Monitors, selecting Rules, and clicking Add Monitor. Give the monitor a descriptive title, select Endpoints from the Category dropdown, choose your metric, and set the Group By field to Endpoint. With that configuration, you’ll receive individual alerts per device rather than fleet-level aggregates, which means a single misbehaving machine surfaces immediately rather than being averaged out.
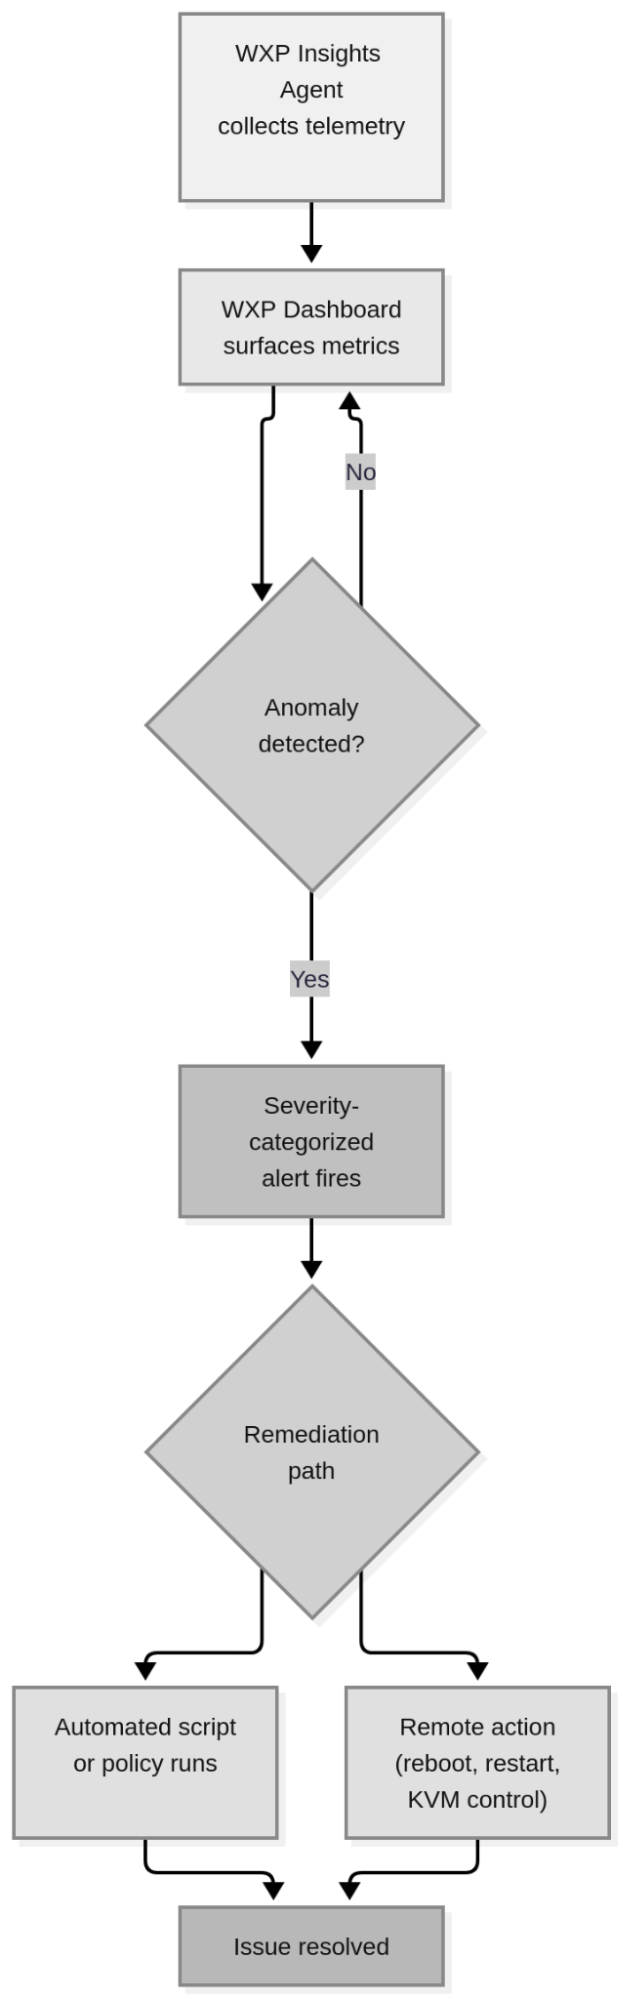
How endpoint monitoring, metrics, and remediation comes together in WXP
Frequently asked questions
What are IT performance metrics?
IT performance metrics are the measurable data points IT teams use to assess the health, stability, and efficiency of devices, applications, and infrastructure. They cover everything from CPU utilization and drive health at the hardware layer to crash rates and security alert counts at the software and policy layer.
What endpoint metrics should IT teams monitor?
For hardware, the core set is CPU utilization, thermal levels, drive health, and battery health. For applications, track performance scores, crash rates, and BSOD frequency. Security posture adds patch compliance status, active alert counts, and policy adherence. Together, these three layers provide a broad view of endpoint health.
How do you monitor endpoint performance?
Deploy a telemetry agent, such as the WXP Insights Agent, across the device fleet, centralize the collected data in a dashboard, and configure severity-based alerts for anomalies. The agent-based approach gives you continuous visibility rather than point-in-time snapshots, and lets you set thresholds that trigger automatically when a metric drifts outside the expected range.
What is the difference between device health and application performance monitoring?
Device health monitoring tracks hardware signals including CPU load, thermals, drive SMART data, and battery capacity. Application performance monitoring tracks runtime behavior, including crash frequency, performance scores, and adoption rates. A device can show healthy hardware metrics while an application conflict generates repeated BSODs, so both layers are required together.
How can IT teams remediate endpoint issues remotely?
Two mechanisms cover most scenarios. Automated policy-driven scripts trigger on alert conditions and deploy to device groups without manual intervention, handling tasks like driver updates and configuration enforcement. Direct remote actions, including rebooting a device, restarting a process, or taking full KVM control, resolve issues that require active intervention without physical access.
What is SMART data and how does it affect drive health monitoring?
SMART (Self-Monitoring, Analysis, and Reporting Technology) provides diagnostic information about drive health, including indicators such as reallocated sectors and read errors. When a drive reports a predictive-failure condition, IT teams may have an opportunity to migrate data and schedule a replacement before the drive fails. Drives begin reporting SMART warning signals well before they fail outright, giving IT teams a window to migrate data and schedule a replacement before any data loss occurs.
How often should IT teams review endpoint performance dashboards?
Review frequency should match the fleet’s size and criticality. Many teams can use automated alerts for continuous monitoring and review summary dashboards on a regular operational cadence. Deeper segmentation by device group, OS build, or location is most useful when a fleet-wide metric spikes, at which point the drill-down view can isolate the affected subset.
What triggers a BSOD and how can monitoring help prevent it?
Blue screen events can be caused by driver conflicts, memory or hardware problems, incompatible updates, and other kernel-level failures. Monitoring BSOD frequency by device group and correlating spikes with recent driver or OS deployments lets you quickly identify the common configuration factor, often before the issue spreads to additional machines.
Can automated remediation handle issues without IT intervention?
Policy-driven scripts can automatically resolve a defined set of issues, including driver updates, BIOS configuration changes, and diagnostic routines, without any manual steps. Issues outside that defined set still require a remote action from an IT team member, but that action can be taken without physical access to the device.
Bringing metrics, monitoring, and remediation together
Proactive endpoint management comes down to knowing which metrics predict failures before they happen and having the tools to monitor those signals. The three-layer framework of hardware health, application stability, and security posture covers those signals, and WXP surfaces them all in one place with automated remediation paths that don’t require physical access or a helpdesk ticket.
Take the WXP Self-Guided Tour or visit the WXP Developer Portal to explore API access and custom integration options.