Automated IT root cause analysis is a pipeline that collects signals from across your environment, correlates them intelligently, identifies the most likely underlying cause rather than a symptom, and connects that finding to a remediation action that executes without a manual handoff.
In many IT environments, incident diagnosis still involves manually correlating alerts, logs, and user reports. When your fleet spans thousands of endpoints across multiple sites, that approach can slow resolution and make it harder to distinguish the underlying cause from downstream symptoms.
This guide covers four practices that make the pipeline work, starting with building a unified telemetry foundation, then properly correlating signals, including endpoint and user context, and closing the loop with automated remediation that has real guardrails.
What automated RCA actually needs to do
Automated RCA replaces manual log investigation with a pipeline that collects signals from across your environment, groups related events, and identifies the most likely underlying cause without requiring an analyst to trace each alert by hand. The pipeline can connect that finding to a remediation workflow that executes automatically when predefined conditions are met.
The cost of reactive troubleshooting is easy to underestimate. When an incident hits, your team faces dozens of simultaneous signals. Every monitoring tool fires at once. Tickets arrive from users describing the same problem in ten different ways. Engineers chase individual alerts without knowing which one reflects the actual failure and which reflect downstream effects.
Alert noise compounds this. High-severity events are often downstream consequences of a lower-level failure that didn’t look alarming on its own. Grouping related alerts and tracing causality backward is work that currently falls on human analysts, which is exactly where the delay lives.
A common gap in server- and application-centric observability is endpoint visibility. Server-side and application monitoring tools provide solid coverage at the infrastructure and app layers, but they may have limited visibility into what’s happening on the devices where users actually work. (memory pressure, driver failures, OS events, application crashes). When issues originate at the endpoint, server-side tools can only see the downstream noise, not the source.
Many RCA challenges are data collection and correlation problems rather than simply analyst-skill problems.
Best practice #1: Build a unified telemetry foundation
A unified telemetry foundation collects signals from every layer of your environment (endpoints, applications, operating systems, and relevant infrastructure) into a consistent data model with shared device identifiers, timestamps, and event schemas. Without a common data model, cross-signal correlation becomes significantly harder and less reliable because each silo blocks causality tracing across layers.
Before anything else, you need a single foundation that covers the entire environment, all feeding into a consistent data model. The signal types worth prioritizing:
- Device health indicators: battery state, thermal data, hardware diagnostics, disk health
- Application performance: crash rates, launch failures, resource utilization by app
- OS events: kernel events, update history, driver state, boot sequence anomalies
- Endpoint state: enrolled configuration, policy compliance, connectivity status
Data normalization turns raw telemetry into something you can actually correlate. Device identifiers, timestamps, and event schemas need to be consistent across sources so that a signal from the OS layer can be matched to a concurrent signal from the application layer on the same device.
Endpoint telemetry can be a weak link, even in otherwise mature stacks. Teams that have invested heavily in infrastructure and application observability frequently discover their endpoint coverage is thin or disconnected. When a meaningful share of enterprise incidents originates at the device layer, that coverage delta becomes the ceiling on how much your RCA pipeline can actually accomplish.
Best practice #2: Correlate signals across time, dependencies, and changes
Signal correlation distinguishes the candidate root cause from the downstream noise it generates. A useful starting point is temporal grouping, identifying alerts that fired within a narrow time window and examining whether they share a common origin rather than representing independent failures. An application crash wave that hits devices across three departments simultaneously warrants a single incident investigation with a shared root cause.
Beyond timing, you need to account for dependency relationships. A network service failure can produce alerts in every application that depends on it. A faulty driver can contribute to symptoms such as application hangs, resource exhaustion, or OS errors, each appearing to be a separate issue when viewed in isolation.
Change context is particularly powerful here. A useful pattern to investigate is whether something changed shortly before the incident. When your correlation layer knows which devices received a software deployment, a configuration push, a driver update, or an OS update in the preceding hours, it can surface that change as a candidate root cause before an analyst even starts digging.
Affected-device count and fleet percentage add a further dimension. If 3% of your fleet shows a specific error pattern after the same update, that scope tells you something meaningful about the cause. If it’s 80%, the severity and urgency change entirely.
High severity tells you to pay attention, but it tells you nothing about why the failure happened or where to look first, and that delta shapes what your pipeline actually does with an alert. HP Workforce Experience™ Platform (WXP) provides a fleet-wide alerts view that surfaces this kind of scope information (affected device counts, impacted user populations), giving the team the context they need to assess incidents rather than treating each alert as an isolated event.
Best practice #3: Include endpoint and user context in RCA
Endpoint-level signals are causal evidence, explaining what’s happening at the layer where the user actually experiences the problem. Memory pressure approaching threshold before an application fails, a driver state that’s been in an error condition for 48 hours before the user files a ticket, an OS fault logged during boot that explains intermittent performance complaints throughout the day. Without these signals, even a well-tuned correlation engine is working with incomplete evidence.
Server-side and application observability tools cover a lot of ground, but the endpoint remains outside their view, and that coverage delta grows as device fleets expand and remote and hybrid work becomes the norm. A digital employee experience (DEX) platform captures this endpoint evidence and complements infrastructure and application telemetry. When you can correlate endpoint health data with application performance and infrastructure state, the AI models doing root-cause identification have a materially more complete picture to work with.
WXP is a practical implementation of this pattern. The WXP Insights agent collects near-real-time telemetry from across the device fleet (device health, application performance, OS events) and feeds that data into AI-assisted analysis. When an alert fires, WXP’s AI identifies the most likely device-level causes and surfaces a Remediation Guide that gives the responding team a prioritized path to resolution without starting from scratch.
DEX platform implementations vary in the depth of AI-assisted analysis they offer. The underlying principle is that endpoint context belongs in your RCA data model, regardless of the tooling you use to capture it.
Best practice #4: Automate remediation with guardrails and verification
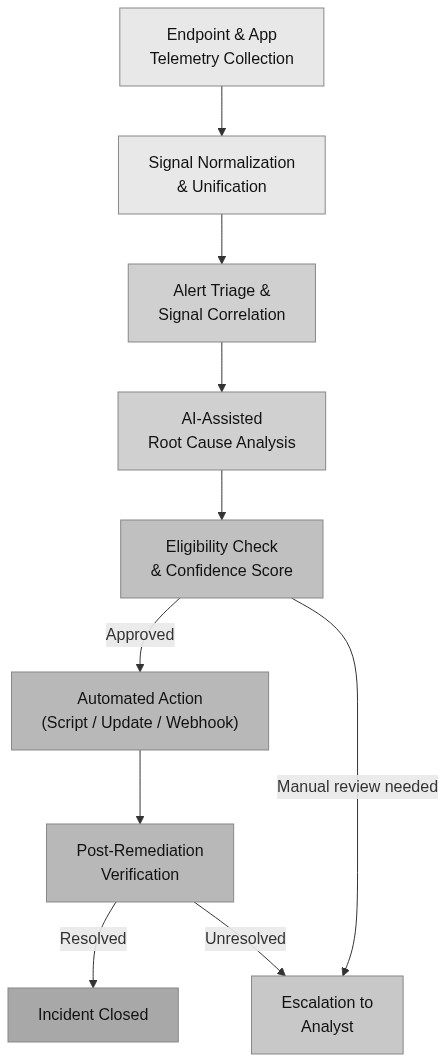
Connected remediation works through a workflow that evaluates eligibility and confidence conditions before executing an action, then verifies whether the action resolved the issue and escalates if it didn’t. Identifying a root cause is only half the problem. Acting on it without requiring someone to manually pick up the finding, review it, decide on an action, and execute it is the other half.
More concretely, the workflow runs like this:
- RCA fires a trigger, where an alert or anomaly detection event initiates a workflow
- Eligibility check runs, where conditional logic verifies the device group, policy state, or risk criteria
- Approved action executes, running a remediation script, applying a driver update, or sending a webhook to create a ServiceNow ticket
- Verification checks the outcome, where the workflow confirms whether the target condition has been resolved
- Escalation if needed, with unresolved cases routing to a human analyst with full context already attached
The guardrails here aren’t optional. Scoped device groups prevent a remediation action from running on hardware it wasn’t tested against. Approval controls ensure that automated workflows only execute what’s been explicitly authorized. Audit logs provide a complete record for compliance and incident review. Post-remediation verification catches cases where the initial fix didn’t hold.
WXP Workflow Builder implements this pattern with a visual, drag-and-drop interface for building event-triggered or scheduled workflows. It supports if/then/else branching logic based on outputs from scripts, webhooks, or driver updates, script execution, device actions like driver deployments, and webhooks to external systems including ServiceNow and Microsoft Teams.
Overall, the whole RCA flow looks something like this:
Frequently asked questions
What is automated IT root cause analysis?
IT Root cause analysis identifies the underlying cause of an incident, not just the symptoms. Automated RCA replaces manual log investigation with AI-assisted telemetry correlation, collecting signals from across your environment, grouping related events, and identifying the most likely cause without requiring an analyst to trace each alert by hand.
How does a DEX platform improve IT root cause analysis?
DEX platforms capture endpoint-level signals (device health, application faults, driver state, OS events) that infrastructure monitoring doesn’t reach. Those signals feed AI models with the data they need to pinpoint causes at the user’s device, which is where a significant share of enterprise incidents originate.
What is the difference between reactive and proactive IT remediation?
Reactive IT remediation waits for a ticket, a user complaint, or an outage before investigating. Proactive remediation uses continuous telemetry and predictive analysis to surface and address issues before users are impacted, often resolving problems the end user never knew existed.
How do you automate IT remediation after identifying a root cause?
Event-triggered workflow design handles this without a manual handoff. An alert fires, branching logic evaluates whether the device and conditions meet eligibility criteria, and an automated action executes, whether that’s running a remediation script, deploying an update, or sending a webhook to an ITSM system. The workflow then verifies the outcome and escalates if the issue isn’t resolved.
Why is endpoint telemetry often missing from RCA pipelines?
Most observability stacks were built around server-side and application monitoring, which means endpoint data lands in a separate system with no shared schema or device identifier. Without a common data model, you can’t correlate an OS fault on a specific device with the application crash that followed it 20 minutes later.
What guardrails should automated remediation workflows include?
Scoped device groups, approval controls, and post-remediation verification are the three non-negotiable guardrails. Scoped groups prevent a fix from running on hardware it wasn’t tested against. Approval controls limit automated execution to explicitly authorized actions. Verification confirms the fix held and routes unresolved cases to a human analyst with full context attached.
How does change context improve signal correlation?
When your correlation layer knows which devices received a software deployment, configuration push, driver update, or OS update in the preceding hours, it can surface that change as a candidate root cause before an analyst starts digging. The most common pattern for production incidents is that something changed and then something broke, so change context can provide a fast path to a likely cause.
Bringing the best practices in RCA together
The four practices build on each other. Unified telemetry gives you the raw material. Signal correlation turns that material into structured incident evidence. Endpoint and user context closes the data delta that server-side observability can’t reach. Automated remediation converts RCA findings into executed fixes without a manual handoff in the middle.
Each layer compounds the one before it. Correlation without complete telemetry produces incomplete results, and remediation automation without solid RCA produces actions taken on incorrect assumptions. All four need to work together.
If you’re managing a distributed device fleet and want to see what this pipeline looks like, take WXP for a spin with the self-guided tour.