Poor application performance is a major productivity drain, and it can happen even when the device fleet is well managed, enrollment is clean, compliance policies are enforced, and the UEM dashboard shows green across the board. Maybe Microsoft Teams crashes during a company-wide call, or Zoom hangs on screen share, and the helpdesk queue fills up. The device dashboard was green. The application experience was not.
A green device health dashboard can tell you that key device management checks are passing, but it won’t necessarily show how individual applications are performing. Closing that delta requires adding a formal application management practice alongside your existing device management workflows.
What application management covers
Application management is the discipline governing the software layer on top of managed devices, covering deployment, version control, health monitoring, and usage governance across the full client-application lifecycle. For endpoint engineers who live in UEM tooling, it’s the practice that answers what’s running, how it’s performing, and whether it’s delivering value.
- Software deployment is the controlled distribution of applications to enrolled endpoints, including initial installation, update pushes, and removal. Pushing a Zoom installer to a device group in Intune is deployment.
- Version and patch management tracks which version of each application is running across the fleet and ensures that updates reach devices on a defined schedule. Version sprawl becomes a real problem here, because if your fleet is running five different versions of Chrome, you can’t reason about stability at scale.
- App health monitoring is the practice of collecting and analyzing runtime telemetry (specifically crash rates, freeze events, and long load times) from applications running on managed endpoints. This goes beyond whether software is installed, measuring how that software performs for employees who depend on it daily.
- Usage governance answers the question of which applications employees actually use versus which ones consume license seats and system resources without delivering value, closing the loop between procurement and IT operations.
Application management covers the software employees interact with daily, including Teams, Chrome, Slack, Zoom, and similar productivity applications running on managed Windows endpoints. Server-side software administration and MDM policy configuration are out of scope.
How app and device signals reinforce each other
App crashes and device-layer conditions are rarely independent. A Teams crash on one machine is a support ticket. The same crash pattern across 300 machines running a specific combination of OS build and graphics driver is a systemic issue you can fix at scale.
The causal chain runs in both directions. A stale OS build introduces compatibility problems that surface as app instability. A driver conflict on a specific hardware model causes freezes in video-conferencing tools during GPU-accelerated rendering. A wave of application crashes can also signal that something changed at the device layer, even before your device monitoring surfaces the root cause directly.
Chasing app signals without device context means guessing at root cause. A crash spike in Teams could trace to a bad update, a driver conflict, or an insufficient RAM configuration, and it becomes much harder to determine which factor is contributing without correlating app telemetry against device properties. Chasing device anomalies without app context means you miss the employee impact entirely. A device that reports marginal memory usage might not trigger a device health alert, but it will produce consistent Teams freeze events for the employee using it.
When application events and device conditions feed into the same data layer, a crash spike in Teams becomes a query you can run against device properties, OS versions, and driver states simultaneously, reducing the amount of manual correlation required during root cause investigation.
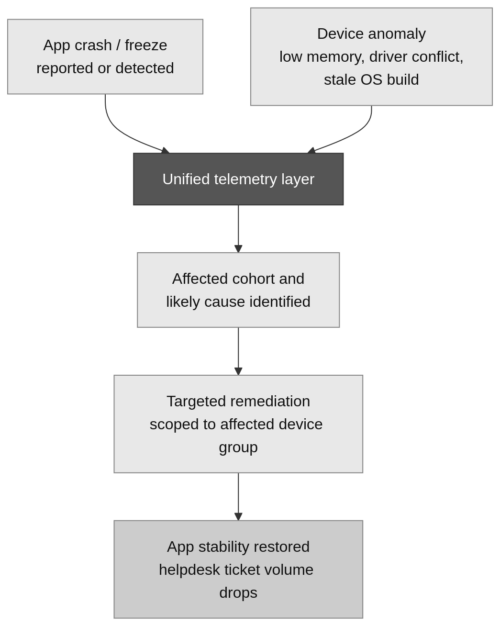
Unified telemetry makes that compression possible by consolidating both app symptoms and device conditions into a single data stream, giving you a single operational loop for faster resolution at scale.
Application health monitoring across the fleet
The HP Workforce Experience™ Platform (WXP) surfaces this unified view through its Application Experience report, accessible under the Analytics section of the platform. The report gives endpoint teams fleet-wide app health visibility without requiring per-device investigation, combining crash trends, version stability data, and impacted device lists in a single interface.
The report starts with an overall application health score, a single numeric value benchmarked against fleet baseline data, that gives you an immediate read on fleet-wide app health before you drill into individual applications.
From there, the crash and freeze trend views show which applications are generating the most incidents over your selected time window. Clicking through to any application opens a version-level breakdown showing which specific versions cause the most crashes and freezes, and which binary files are associated with crash events. If you’re deciding whether to push Teams version 24310.x to your full fleet, and the report already shows that version 24299.x has a 40% higher crash rate than 24285.x in your pilot group, you have the data to hold off on the update until it reaches 3,000 endpoints.
Long load time detection gives you a separate signal beyond crashes and freezes. An application that takes 45 seconds to open after login doesn’t crash, but it generates friction and informal workarounds that never surface in a helpdesk ticket.
The impacted device list ties app symptoms back to hardware and OS configurations. If 80% of Teams crashes concentrate on devices running a specific chipset and driver combination, that correlation appears in the device-level data linked to the crash events, so you stop theorizing and work from an identified cohort instead.
App deployment and remediation at scale
Visibility produces a finding. Remediation closes it. Acting on what the Application Experience report surfaces follows three steps.
Create a dynamic device group.
In WXP, navigate to Groups and create a new group with Dynamic membership. You can define rules based on device properties such as operating system version, device model, or manufacturer, giving you a precise scope for remediation. If you’re already using Entra ID groups in your Intune environment, WXP automatically syncs those organizational groupings, so you don’t need to rebuild your segmentation. Your existing role-based groups become remediation targets without any duplicate configuration work.
Scope and deploy the fix.
With the group defined, go to the Remediation module and assign a script or policy to that group. If the issue is a bad app version, push the corrected installer to affected endpoints. If the root cause is a driver conflict, deploy the updated driver through a remediation policy scoped to the affected device cohort. The Remediation Activity page tracks execution status for each device, so you can confirm the fix has landed and identify any endpoints that returned errors.
Get the Insights Agent onto your existing toolchains.
If you’re deploying WXP to a fleet already managed through Intune or SCCM, you don’t need a parallel deployment infrastructure. The WXP Insights Agent ships as an MSI you deploy through either tool, with the Company PIN (CPIN) passed as an install parameter. Retrieve your organization’s CPIN from Settings > Preferences in WXP, then reference it in your Intune Win32 app install command or your SCCM Create Application Wizard. Agent download details and full deployment documentation are at workforceexperience.hp.com/software.
After deployment and enrollment, the agent connects to WXP, and the required components are installed based on the deployment method.
Frequently asked questions
What is application management in IT?
Application management is the practice of deploying, monitoring, updating, and governing the software employees use on work devices. It covers the client-application lifecycle, from initial installation and version control through health monitoring, updates, and eventual removal. It is distinct from device enrollment, OS policy management, and server-side software administration.
How does application management differ from device management?
Device management governs hardware configuration, OS policy, compliance, and enrollment. Application management focuses on the software layer running on those managed devices, including which versions are installed, how applications perform for employees, and how updates and fixes are deployed. The two disciplines address different layers of the same managed fleet.
What is digital employee experience (DEX) management?
DEX management is the practice of monitoring and improving both device and application conditions that affect employees’ IT experience at their workstations. It goes beyond uptime to include metrics such as app load time, crash frequency, and freeze rate, treating them as indicators of employee productivity rather than purely technical health signals.
How can I monitor application health across a large device fleet?
A DEX platform with a dedicated application health report gives you fleet-wide visibility without requiring per-device investigation. The HP Workforce Experience™ Platform (WXP) Application Experience report covers crashes, freeze events, load times, and version stability across all enrolled devices. The version-level breakdown shows which app versions are stable and which to hold before broader deployment, and the impacted device list ties those findings back to specific hardware and OS configurations.
Why do app crashes and device health signals need to be in the same data layer?
When application telemetry and device properties are stored separately, administrators may need to manually correlate information from multiple sources during an investigation. A unified telemetry layer lets them examine application events alongside OS versions, driver states, hardware models, and other device properties, making it easier to identify affected cohorts and investigate potential contributing factors.
What types of app telemetry does WXP collect?
The WXP Application Experience report provides application telemetry including crash events, freeze events, long load times, and version-level stability data across enrolled endpoints. It can also show binary files associated with crash events and link application symptoms to hardware and OS configurations via the impacted device list.
How do I deploy the WXP Insights Agent to an existing Intune-managed fleet?
The WXP Insights Agent can be deployed through Intune as a Win32 app using the MSI installer and your organization’s Company PIN (CPIN). Retrieve the CPIN from Settings > Preferences in WXP and pass it as an installation parameter in your Intune deployment. After deployment and enrollment, the agent connects to WXP, and the required components are installed based on the deployment method.
What is version sprawl and why does it affect app stability analysis?
Version sprawl occurs when multiple versions of the same application run simultaneously across a managed fleet, often because of inconsistent update policies or missed update pushes. It can make application stability data harder to interpret because administrators need to distinguish between version-specific problems and broader issues. Consistent version management makes it easier to analyze application health and make informed deployment decisions.
One operational loop, two disciplines
Once telemetry is unified, device and application management become a single operational loop. Your Intune-enrolled fleet feeds device context into the same platform where you read crash trends, identify unstable app versions before they reach the full fleet, and push fixes to precisely scoped device groups.
Managing devices through a single toolchain while treating application health as a separate concern results in the situation most endpoint teams already know well: a green device dashboard alongside a helpdesk queue full of Teams tickets. Bringing both disciplines into a single telemetry layer closes that delta.
Take a self-guided tour of WXP at workforceexperience.hp.com/demos/ to see how application and device management come together in one place.